Solar ROI Calculator: How to Calculate Your Solar Payback Period & Returns in India
Evaluating top solar companies in India is essential for homeowners and commercial enterprises seeking to transition to clean energy while optimizing long-term capital efficiency. Engaging accredited solar companies in India ensures high photovoltaic module efficiency, structural durability, and seamless utility grid integration. Using a Solar ROI calculator, property owners across the country can accurately model payback timelines, 25-year bill savings, and annualized investment returns.
In 2026, rooftop solar photovoltaic systems in India reach full capital payback within 3 to 5 years, unlocking over two decades of near-zero-cost electricity. Through a Solar ROI calculator India, consumers evaluate how central incentives under the PM Surya Ghar Muft Bijli Yojana, progressive state electricity distribution company (DISCOM) tariff slabs, and local solar irradiance shape their financial recovery schedule.
What Is Solar ROI?
Solar ROI (Return on Investment) measures the percentage financial return generated by a rooftop solar installation over its operational lifetime by comparing cumulative electricity bill savings against the net capital outlay post-subsidy. In the Indian energy market, residential solar installations yield an annual return ranging between 20% and 30%, establishing solar panel return on investment India metrics among the highest performing low-risk financial assets available.
Understanding solar financial performance requires evaluating three distinct financial indicators:
- Return on Investment (ROI): The total percentage financial gain achieved over the 25-year warrantied life of the system relative to the net post-subsidy expenditure.
- Payback Period: The duration, expressed in years and months, required for cumulative utility bill savings to fully cover the net initial setup cost.
- Internal Rate of Return (IRR): The annualized effective yield accounting for the time value of money, enabling direct comparison against fixed deposits, equity index funds, or real estate.
|
Investment Instrument |
Typical Annual Return (IRR) |
Risk Profile |
Tax Status of Returns |
|
Rooftop Solar PV (Residential) |
20% – 28% |
Low–Moderate (Physical Asset, Weather-Dependent) |
Tax-Free (Direct Bill Savings) |
|
Fixed Deposit (FD) |
6.5% – 7.5% |
Very Low |
Taxable at Income Slab Rate |
|
Mutual Funds (Equity Index) |
11.0% – 13.0% |
Moderate–High (Market-Linked) |
Taxable (STCG / LTCG) |
Note: Figures serve as illustrative financial benchmarks; actual solar yield depends on site-specific irradiance, component efficiency, and local DISCOM rates.
Why Solar ROI Matters More in India in 2026
Evaluating whether solar is a good investment in India requires analyzing three major macroeconomic shifts: central financial assistance, rising utility tariffs, and localized technological advancements. Partnering with leading solar companies in India provides access to high-efficiency N-type TOPCon and Mono-PERC solar modules that maximize generation per square meter.
Key drivers improving the PM Surya Ghar subsidy ROI for Indian households include:
- Direct Central Subsidies: Financial assistance up to ₹78,000 for residential systems up to 3 kW under PM Surya Ghar.
- Widespread Grid Interconnection: Simplified policies for net metering solar installations across state DISCOMs.
- Compounding Tariff Increases: Retail electricity tariffs rise by 4% to 8% annually, accelerating cumulative savings.
- 25-Year Performance Warranties: Standard linear production guarantees protect long-term generation.
- Telescopic DISCOM Tariff Slabs: Solar generation directly removes the top, most expensive utility billing tier first.
Using a Solar ROI calculator India model allows property owners to visualize how these macro factors shorten payback timelines. By evaluating projections on a Solar ROI calculator, homeowners can quantify the exact compounding impact of annual tariff escalation
How Does a Solar ROI Calculator Work?
A solar payback period calculator processes technical, geographic, and financial variables to generate site-specific economic models. High-performance platforms also integrate a solar net meter calculator engine to compute grid export compensation.
- Data Input Ingestion: Captures pincode, sanctioned load, monthly bill expenditure, and electricity unit consumption (kWh).
- Solar Irradiance Mapping: References geographic coordinates against regional solar radiation databases (averaging 4.5 to 5.5 peak sun hours daily across India).
- System Sizing & Optimization: Recommends system capacity (kWp) tailored to offset 80% to 100% of grid power consumption.
- Subsidy Calculation: Applies central PM Surya Ghar rules and applicable state top-ups to calculate net upfront expenditure.
- Financial Output Generation: Uses a solar panel savings calculator framework to compute payback timelines, 25-year cumulative savings, Levelized Cost of Energy (LCOE), and internal rate of return.
The Solar ROI & Payback Period Formula
Calculating payback duration and lifetime financial yield relies on simple standard formulas.


Where:


Worked Example: 3 kW Residential System (2026 Benchmarks)
The following financial model illustrates a standard 3 kW residential rooftop solar installation under 2026 PM Surya Ghar subsidy guidelines:
|
Financial / Technical Parameter |
Benchmark Value |
Context & Assumptions |
|
System Capacity |
3.0 kWp |
Standard urban residential setup |
|
Gross Installed System Cost |
₹1,60,000 |
Turnkey installation cost |
|
PM Surya Ghar Central Subsidy |
₹78,000 |
Maximum central subsidy slab |
|
Net Initial Capital Cost |
₹82,000 |
Net out-of-pocket investment |
|
Average Daily Solar Yield |
12.6 kWh (Units) |
Based on 4.2 peak sun hours / day average |
|
Annual Electricity Generation |
~4,600 kWh |
Factoring in monsoon season reductions |
|
Effective DISCOM Utility Tariff |
₹7.50 / kWh |
Average mid-to-upper billing slab rate |
|
First-Year Electricity Bill Savings |
₹34,500 |
4,600 kWh × ₹7.50 / kWh |
|
Estimated Simple Payback Period |
2.38 Years |
Net Cost (₹82,000) ÷ Year 1 Savings (₹34,500) |
Step-by-Step: How to Calculate Your Own Solar ROI
Learning How to calculate solar ROI manually allows consumers to audit installer quotes and utility billing structures.
- Gather Utility Bills: Collect 12 months of electricity bills to find average monthly unit consumption (kWh).
- Identify Marginal Tariff: Check your DISCOM's upper slab rate per unit including taxes and fuel adjustments.
- Determine Roof Area: Confirm at least 100 sq. ft. of shadow-free rooftop space per 1 kW capacity.
- Size System Capacity: Select recommended system size (kW) based on daily energy consumption.
- Get Hardware Proposals: Obtain quotes covering ALMM-listed panels, inverter, and mounting structures.
- Calculate Net System Cost: Deduct PM Surya Ghar central subsidy (up to ₹78,000) and state top-ups.
- Estimate Annual Savings: Multiply annual solar output (kWh) by your effective DISCOM unit tariff.
- Compute Payback Timeline: Divide net cost by annual bill savings.
- Project 25-Year Cash Flows: Factor in 4%–6% annual tariff escalation and 0.5% annual module degradation
Rather than conducting complex manual modeling, homeowners can use Rayzon Solar's free solar ROI calculator to instantly compute payback periods, annual savings, and lifetime returns.
What Is a Good Solar Payback Period in India?
In India, a payback period of 3–5 years is considered excellent for residential rooftop solar; 5–7 years is good; anything above 7 years warrants a review of your system quote or roof conditions. Evaluating the solar payback period India homeowners experience helps benchmark financial feasibility prior to installation
|
Payback Horizon |
Performance Rating |
Market Context |
|
Under 3 Years |
Excellent |
High tariff states (₹8.00+/unit), optimal roof orientation, full subsidy capture. |
|
3 to 5 Years |
Standard / Benchmark |
Average residential performance under PM Surya Ghar subsidies across India. |
|
5 to 7 Years |
Moderate |
Low DISCOM tariff slabs, zero state-level add-on subsidies, or non-subsidized commercial setups. |
|
Above 7 Years |
Review Required |
Shading issues, suboptimal roof angle, or inflated component costs. |
Lifetime Savings: Long-Term Solar Investment Returns India
Analyzing Solar investment returns India over two decades shows that once payback is achieved (typically 3 to 5 years), the system enters a long-term "profit zone". Electricity generated during the remaining 20+ years functions as direct tax-free financial profit.
Key pointers on lifetime financial yields:
- Compounding Savings: Because grid tariffs rise continuously (~5% annually), monetary savings per generated unit grow each year.
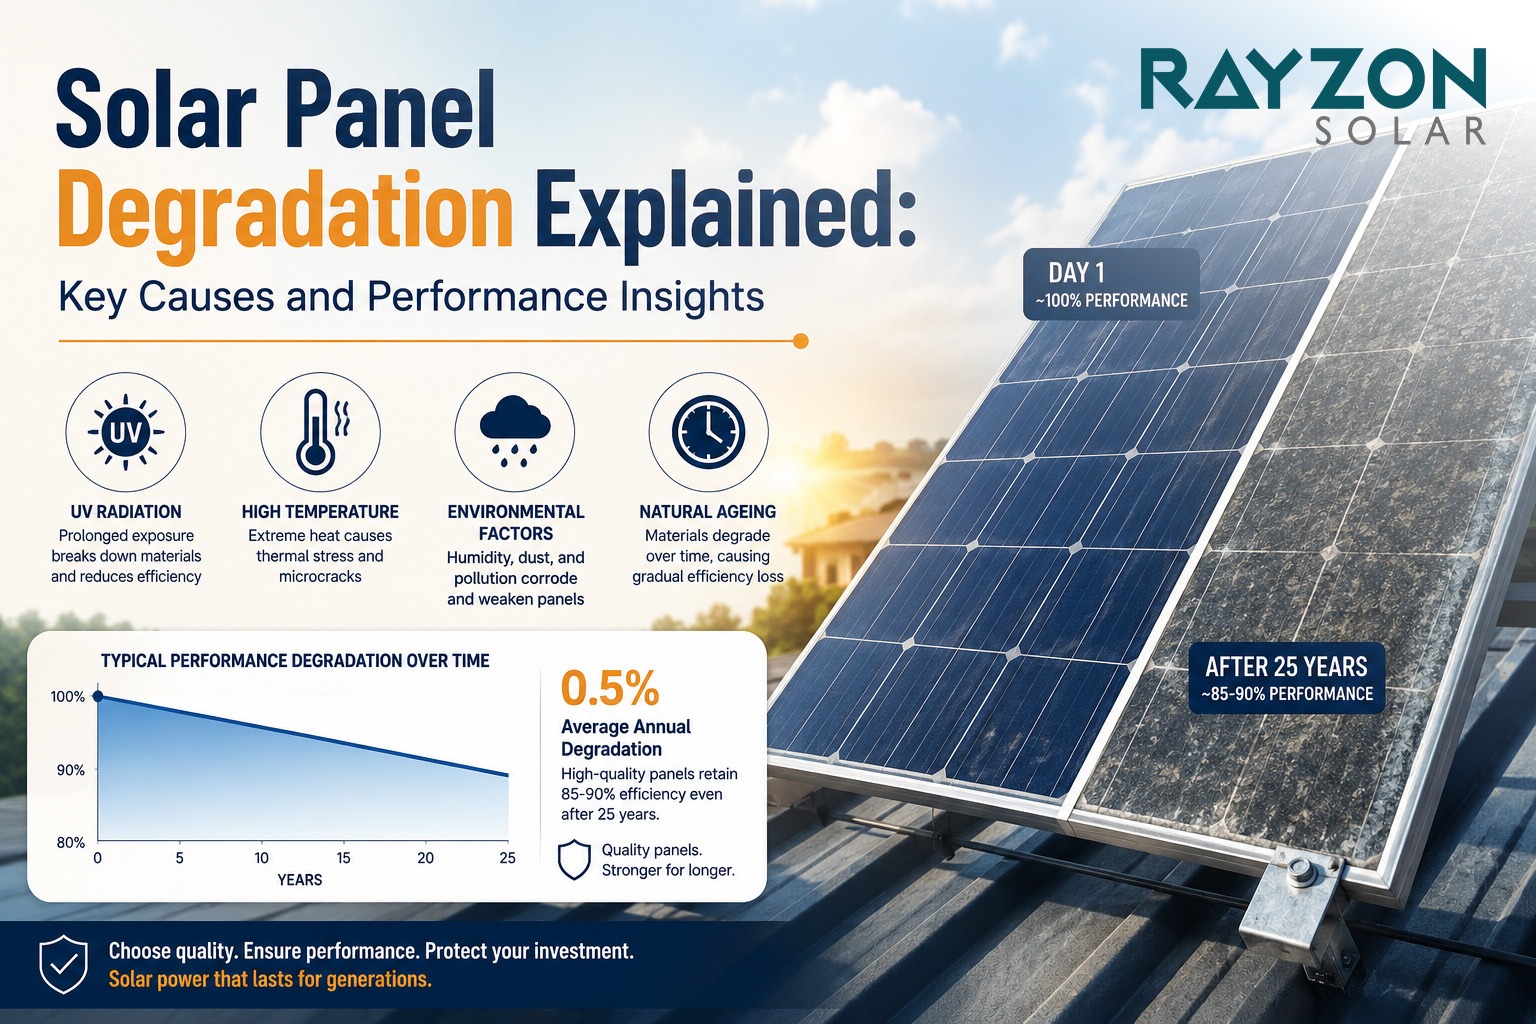
- Minimal Degradation: Accounting for panel output degradation is essential for accurate, compliant lifetime projections. Photovoltaic panels provided by Tier-1 solar companies in India typically retain ~80% to 85% of their original output capacity at Year 25 under standard manufacturer performance warranties. Factoring this standard ~0.5% annual degradation into long-term financial models ensures calculating the solar panel return on investment India remains realistic and accurate.
- 25-Year Value: Calculating the solar panel return on investment India over 25 years reveals total cumulative bill savings ranging between ₹5 lakh and ₹12 lakh for standard homes.
Factors That Affect Your Solar ROI in India
Understanding the key factors affecting solar ROI and what affects solar payback period timelines allows property owners to optimize system performance and maximize financial returns.
Your State's Electricity Tariff & DISCOM Slab
Higher tariff states (e.g., higher-slab DISCOMs) see faster payback since solar offsets the costliest consumption tier first.
Roof Orientation, Tilt & Shading
A shadow-free, south-facing roof performs closest to ideal; shading from tanks, trees, or neighboring structures can meaningfully extend payback.
Since roof-specific factors like shading and orientation can shift your payback period by months or years, it's worth getting a professional read on your actual roof before finalizing system size. book a free Rayzon Solar rooftop assessment to get a site-specific ROI estimate.
System Size vs Actual Consumption
Oversizing or undersizing directly affects the savings-to-cost ratio and overall payback efficiency.
PM Surya Ghar Subsidy Eligibility
Central government subsidies play a critical role in improving overall PM Surya Ghar subsidy ROI metrics.
|
System Size Slab |
Central Subsidy Amount |
Financial Outlay Impact |
|
1 kW |
₹30,000 |
Reduces initial system cost by 35% – 45% |
|
2 kW |
₹60,000 |
Reduces initial system cost by 40% – 50% |
|
3 kW and Above |
₹78,000 (Maximum Cap) |
Offsets ~40% of 3 kW system; percentage drops for larger systems |
Net Metering Policy in Your State
The specific regulatory framework governing net metering solar connections determines how exported surplus energy is credited. Selecting reputed solar companies in India guarantees proper application filing and compliance with local DISCOM interconnection standards.
Quality of Panels & Inverter
Higher-efficiency panels and reliable inverters reduce long-term maintenance/replacement costs that eat into ROI.
Annual Electricity Tariff Escalation
Historically ~4–6% YoY in India; higher escalation improves long-term ROI by increasing the monetary value of generated power over time.
Installation & O&M Quality
Poor installation (wrong angle, inadequate wiring) silently reduces generation and stretches payback timelines
Solar ROI vs Other Investments in India
Solar delivers tax-free, inflation-hedged returns via bill savings, often outperforming traditional low-risk instruments over a 25-year horizon -while carrying its own risks (weather, panel/inverter issues, DISCOM policy shifts). Evaluating Solar panel cost vs savings India dynamics alongside traditional asset classes demonstrates why rooftop solar yields competitive risk-adjusted returns. Comparing solar vs mutual funds returns and examining if is solar better than FD accounts reveals how direct bill savings eliminate market volatility
|
Investment Metric |
Rooftop Solar PV |
Fixed Deposit (FD) |
Mutual Funds (Equity) |
Real Estate (Rental) |
|
Annual Yield (IRR) |
20% – 28% |
6.5% – 7.5% |
12% – 14% |
2% – 4% (Rental Yield) |
|
Payback Horizon |
3 – 5 Years |
At Maturity |
Market-Dependent |
Long-Term Capital Lock |
|
Tax Treatment |
Tax-Free Savings |
Taxed at Income Slab |
Taxed (STCG / LTCG) |
Taxable Rental Income |
|
Inflation Protection |
High (Tracks Tariff Hikes) |
Low |
High |
Moderate |
|
Investment Risk |
Very Low (Physical Asset) |
Very Low |
Moderate–High |
Moderate |
Disclaimer: Solar returns depend on geographic solar irradiance, system quality, and DISCOM policies. Figures serve as comparative financial illustrations, not guaranteed returns.
OPEX & Maintenance Costs to Factor Into ROI
Grid-tied rooftop solar systems have no moving mechanical parts, resulting in minimal operational expenditure (OPEX). However, precise financial modeling must account for basic upkeep:
- Routine Panel Cleaning: Dust accumulation reduces generation by 5% to 15%. Bi-weekly water cleaning restores peak efficiency.
- Inverter Servicing & Replacement: Inverters come with standard 8 to 10-year warranties. Reserve funds for one inverter replacement between Year 10 and Year 12 (~15%–20% of original system cost).
- System Inspections: Annual checks of electrical cabling, protection earthing, and the net metering solar system connection maintain system safety.
State-Wise Solar Payback Snapshot
Electricity tariffs, local DISCOM policies, and state subsidy top-ups vary across Indian states. Higher retail tariff rates directly shorten payback duration.
|
State |
Primary DISCOMs |
Peak Retail Tariff (Upper Slab) |
Combined Subsidy Allocation |
Est. Payback Period (3 kW) |
|
Maharashtra |
MSEDCL, Tata Power, Adani |
₹8.95 – ₹11.50 / unit |
₹78,000 (Central) |
2.5 – 3.5 Years |
|
Delhi |
BSES Yamuna/Rajdhani, TPDDL |
₹6.50 – ₹8.00 / unit |
₹78,000 (Central) + Solar Policy Credits |
3.0 – 4.0 Years |
|
Gujarat |
DGVCL, MGVCL, PGVCL, UGVCL |
₹5.50 – ₹6.80 / unit |
₹78,000 (Central) + State Top-Up |
3.0 – 4.0 Years |
|
Uttar Pradesh |
UPVCL, DVVNL, PuVVNL |
₹7.00 – ₹10.20 / unit |
₹78,000 (Central) + ₹15,000 (State) |
2.8 – 3.8 Years |
|
Karnataka |
BESCOM, MESCOM, HESCOM |
₹7.00 – ₹9.50 / unit |
₹78,000 (Central) + ₹5,000 State Add-On |
3.2 – 4.2 Years |
|
Tamil Nadu |
TANGEDCO |
₹6.50 – ₹9.00 / unit |
₹78,000 (Central) + ₹6,000 State Add-On |
3.5 – 4.5 Years |
|
Rajasthan |
JVVNL, AVVNL, JDVVNL |
₹6.50 – ₹8.50 / unit |
₹78,000 (Central) + ₹17,000 (State) |
2.8 – 3.5 Years |
|
West Bengal |
WBSEDCL, CESC |
₹7.90 – ₹10.50 / unit |
₹78,000 (Central) |
2.8 – 3.6 Years |
Common Myths About Solar ROI in India
- Myth 1: "Solar panels do not operate efficiently in hot weather."
Fact: Photovoltaic panels operate on sunlight intensity, not ambient heat. High temperatures cause minor efficiency drops, but overall generation in India remains high. Trusted solar companies in India ensure proper ventilation beneath mounting structures to maintain cooling.
- Myth 2: "Government subsidies cover 100% of installation costs."
Fact: Central PM Surya Ghar subsidies offer fixed slab incentives capped at ₹78,000 for residential systems, covering roughly 40% to 50% of total 3 kW system costs.
- Myth 3: "Payback periods are uniform across all Indian states."
Fact: Payback timelines vary based on regional DISCOM billing slabs, state subsidy top-ups, and geographic solar irradiance.
- Myth 4: "Rooftop solar systems require zero maintenance over 25 years."
Fact: Maintenance is low but necessary: periodic panel cleaning is required, alongside an inverter replacement around Year 10 to 12.
How to Choose the Right Solar ROI Calculator
Selecting an accurate Solar ROI calculator India tool requires verifying that its underlying engine incorporates key local variables:
- Exact DISCOM Slab Integration: The tool must apply actual progressive tariff tiers rather than simplified national averages.
- Automated PM Surya Ghar Rules: It should apply current subsidy slabs (capped at ₹78,000) and regional state top-ups.
- Long-Term Degradation Factors: The calculator must model annual PV module output degradation (~0.5% per year).
- Tariff Escalation Modeling: It should account for compounding annual utility rate increases (~4%–6% per year).
When using a solar panel savings calculator, ensure it incorporates these site-specific variables. A strong solar payback period calculator should also offer visual cash flow projections over 25 years. Established solar companies in India provide digital platforms that combine financial modeling with physical rooftop layout analysis.
Conclusion: Is Solar Worth It in India?
Evaluating whether solar is a good investment in India yields a clear yes for most homeowners and businesses with adequate rooftop access. Driven by central PM Surya Ghar subsidies, compounding utility tariff hikes, and long hardware warranties, rooftop solar achieves capital payback within 3 to 5 years, followed by over two decades of near-free electricity.
Inputting your figures into a Solar ROI calculator reveals the exact long-term return on investment available for your property. Partnering with top solar companies in India optimizes ROI, ensures smooth net meter connection processing, and guarantees long-term energy independence.
Frequently Asked Questions (FAQs)
What is a good ROI for a solar system in India?
A good residential solar ROI in India ranges between 20% and 30% annually. This corresponds to a payback period of 3 to 5 years, unlocking over 20 years of near-zero-cost power generation.
How does the PM Surya Ghar subsidy affect solar ROI?
The PM Surya Ghar Muft Bijli Yojana provides direct central subsidies up to ₹78,000 for residential systems up to 3 kW. This incentive reduces net upfront setup costs by 40% to 50%, shortening the payback period by 1.5 to 2 years.
What is net metering and what is the benefit of the net metering policy?
Understanding what net metering solar comes down to grid integration: the benefit of the net metering policy is that it allows consumers to send surplus daytime solar electricity to the utility grid. These exported units generate bill credits that offset night-time grid consumption, lowering monthly power bills by up to 90%.
How do I submit a solar net meter application in India?
To submit a solar net meter application, register on your local DISCOM portal or the national PM Surya Ghar portal. Experienced solar companies in India handle document submission, technical feasibility approvals, and physical inspection on behalf of consumers.
What is the typical solar net meter price and setup cost?
The bi-directional solar net meter price ranges from ₹2,000 to ₹3,500 for single-phase connections and ₹4,000 to ₹6,000 for three-phase setups. DISCOM application processing and inspection fees typically add ₹500 to ₹2,500.
What is net billing vs net metering for solar installations?
In net billing vs net metering, net metering credits exported units at full retail electricity tariff rates. Net billing credits exported power at a lower fixed Feed-In Tariff (FIT), while charging standard retail rates for imported electricity.
How do I learn how to read solar net meter in India displays?
Knowing how to read net meter displays requires checking the digital screen parameters. The meter cycles through imported energy (kWh from grid), exported energy (kWh from solar), and net billable power balance (import minus export).
What is the difference between gross metering and net metering?
When comparing the difference between gross metering and net metering, gross metering exports 100% of solar generation directly to the grid at a feed-in tariff. Net metering allows the building to consume solar power first, exporting only excess electricity.
Is solar a better investment than a bank fixed deposit in India?
Rooftop solar yields a tax-free return of 20% to 28% through direct electricity bill reduction, whereas fixed deposits return roughly 6.5% to 7.5% before income taxes. Solar also acts as a hedge against rising utility electricity tariffs.
How accurate are online Solar ROI calculators?
An online Solar ROI calculator India model combines site solar irradiance, progressive DISCOM tariff slabs, central subsidies, and annual panel degradation rates (~0.5% p.a.) to project exact cash flows and payback years.
How accurate are online Solar ROI calculators?
An online Solar ROI calculator provides close estimates based on state averages, though a physical site assessment is recommended for exact engineering estimates.